Figures and animations made from my own research data


Bjarke Nilsson
PhD Student

Contact


A hobby and a passion of mine has always been to create visualisations of scientific data to better communicate concepts and results. Working towards a PhD and obtaining results of my own during my career has enabled this even more, as I have my own data to work with. Here are some of the examples of work i have been doing!


The 2025 Kamchatka tsunami seen by SWOT My animation of the tsunami from the magnitude 8.8 Kamchatka earthquake on 29 July 2025: the wave is first detected by a DART ocean-pressure sensor about 30 minutes later, and SWOT captures the leading wave about 70 minutes after the earthquake. Combining the observations allows the earthquake slip to be inverted (Sepúlveda et al. 2026, Science).
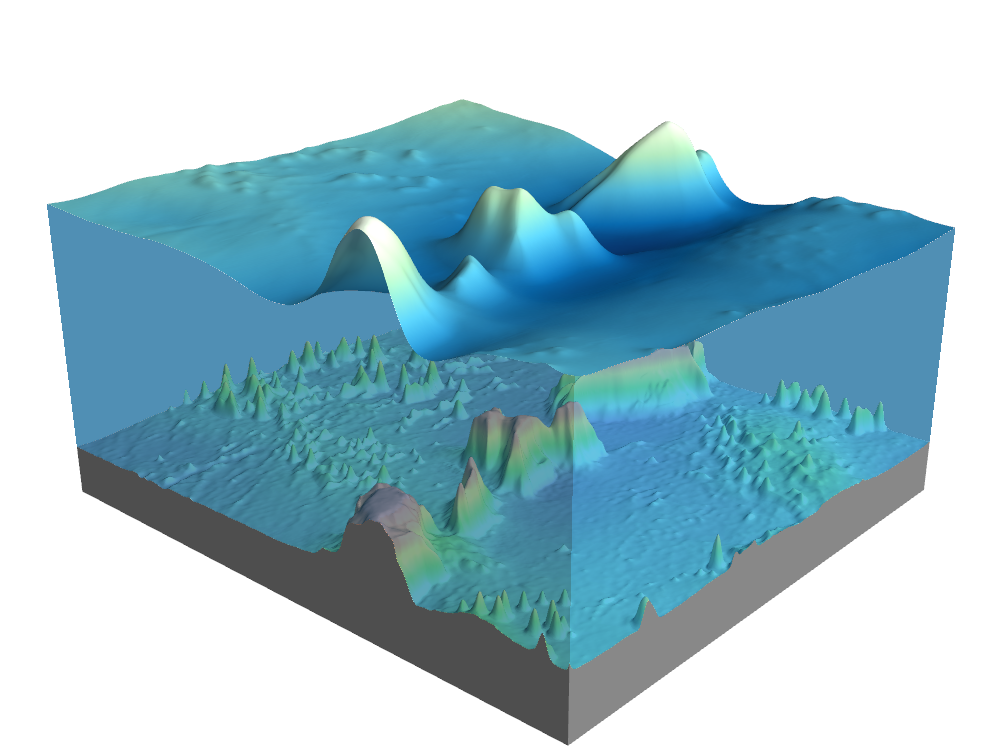
3D block of the ocean showing seamounts on the seafloor and the bumps they cause in the sea surface above
The sea surface mirrors the seafloor The extra mass of seamounts pulls water towards them, creating bumps in the sea surface that satellites can measure.
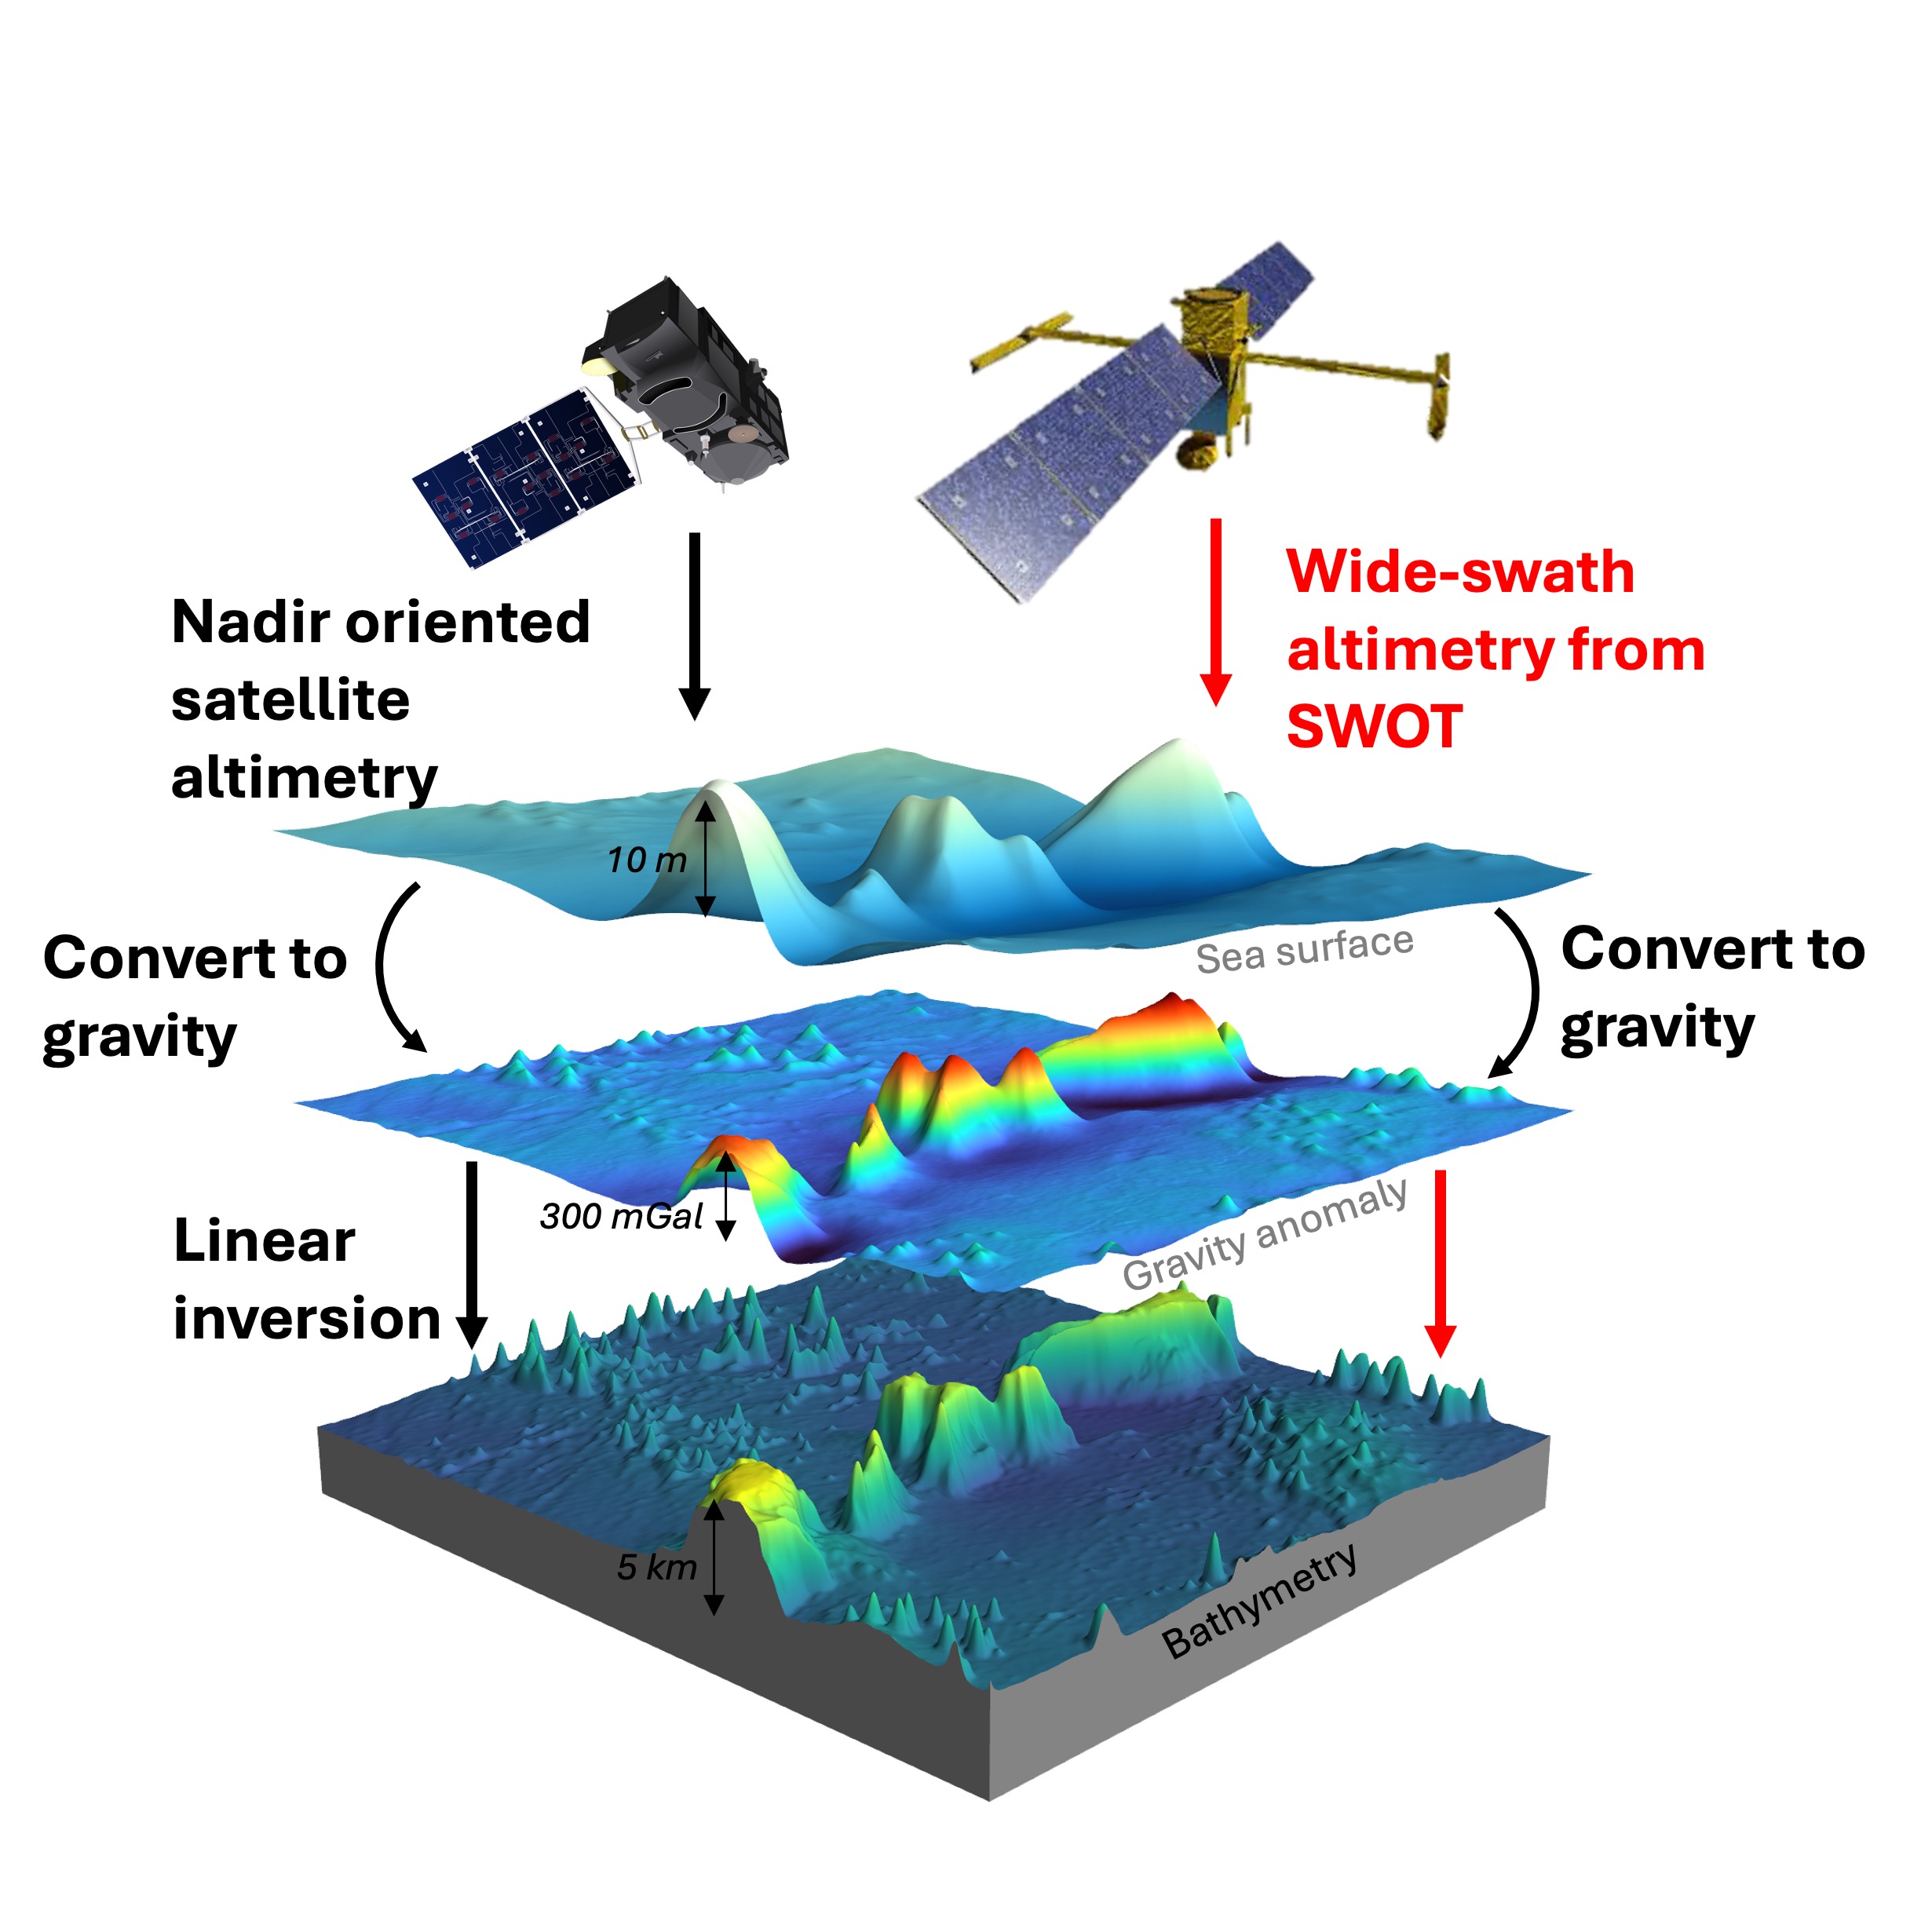
Illustration of nadir and wide-swath (SWOT) altimetry, and how the sea surface is converted to gravity and inverted to bathymetry
From sea surface to seafloor How sea surface heights from nadir and wide-swath (SWOT) altimetry are converted to gravity and inverted to bathymetry.